Lesson 12 · 90 minutes · 12 parts
Trends
What marketing is using right now and what’s coming: how to read and predict trends, adaptability and geopolitics, simplicity, automation, custom AI, new platforms, hardware and digital detox.
This lesson has no English narration yet. The Czech version is narrated.
What you will take away
- -Tell a fad from a trend and a megatrend, and place an innovation on Rogers’ adoption curve.
- -Read the hype cycle and trend reports critically: methodology, sample, who paid for it.
- -Have a framework for adaptability (stable core, mutating edges, the OODA loop) and know what geopolitics does to channels.
- -Build a simple automation (Zapier, Make, n8n) and a custom AI project without the illusion of “training.”
- -Know where VR, AR, smart glasses, wearables and LED walls stand, and what that means for content.
- -Work with attention: your own and your customer’s.
Lesson plan
- 5 minIntro and a question for the class · What did you start using this year that you didn’t know last year? And what did you stop using? Answers go on the board; we’ll come back to them with Rogers.
- 5 minStudent presentation · Bring one thing you started using this year and say whether you think it’s a trend or a fad, and why.
- 12 minWhat a trend is and how it’s predicted · Fad, trend, megatrend; the Rogers curve and the chasm; the hype cycle; reports and free signals, Google Trends live.
- 11 minAdaptability and geopolitics · Kodak, Blockbuster, OODA; TikTok in the US, tariffs, the AI Act, cookies; a one-page PEST.
- 14 minWhat’s in use, KISS and inspiration · Social and video ahead of TV, zero-click search, sustainability, Czech platform reach; 15,505 tools and three tokens; three sources and four questions before you buy.
- 10 minAutomation and custom AI · Zapier, Make, n8n: a workflow built in advance and a live test; GPTs and Claude projects: instructions, knowledge, testing.
- 10 minHardware and attention · VR, glasses, AR, rings, LED walls, esports; digital detox and numbers from Czechia.
- 15 minExercise: trend radar · In groups of three, pick one trend from the lesson or one of your own. Place it on the Rogers curve and the hype cycle, find three independent signals (search interest, competitors, a report) and one counter-signal. Design a one-month test for your club or brand: goal, audience, channel, form, metric, owner.
- 8 minPrinciples, summary and quiz · Trends are a radar, not a steering wheel; cadence and tool reviews (3 min). Five quiz questions (5 min).
Contents
- 1What’s a trend and what’s just a fad
- 2How trends are predicted
- 3Adaptability: markets change like nature
- 4Geopolitics and markets
- 5What marketing is using right now
- 6Simplicity as a trend (KISS)
- 7Tools and where to find inspiration
- 8Automation: Zapier, Make, n8n
- 9Custom GPTs and Claude projects
- 10Hardware: VR, smart glasses, wearables, LED walls
- 11Digital detox and attention
- 12Management and principles that outlast trends
1What’s a trend and what’s just a fad
A trend is a change in behavior, not an invention
- ·Fad: weeks · trend: years, changes behavior · megatrend: decades
- ·Rogers 1962: innovators and early adopters together are only 16%
- ·The chasm before the majority: that’s where most innovations end
- ·Test: is your aunt using it yet? Does search interest show steps or a spike?
A trend is a change in behavior that lasts for years and survives its first headline. A fad is a wave that lasts weeks: it shoots up, everyone talks about it, and six months later nobody uses it. A megatrend is a shift over decades: urbanization, Europe’s aging population, digitalization. For a marketer, the difference is crucial: you invest a campaign in a fad, a channel and people in a trend, and a strategy in a megatrend. The most common mistake is to take a fad for a trend and build a yearly plan on it. The second most common is the opposite: to declare a trend a fad and ignore it for five years.
The most widely used map of how innovations spread is the diffusion of innovations theory, published by sociologist Everett Rogers in 1962. Rogers divided people by when they adopt something new: 2.5% innovators, 13.5% early adopters, 34% early majority, 34% late majority and 16% laggards. The curve is bell-shaped: a few enthusiasts, then the masses, and finally the people who buy a smartphone only when their feature phone stops working. In the late 1980s, consultants at the firm Regis McKenna, and Geoffrey Moore in his book Crossing the Chasm (1991), added the chasm between early adopters and the early majority: enthusiasts want something new, pragmatists want a working solution with references. Most innovations end up in the chasm.
How do you tell where a trend is on the curve? Ask who’s using it. If only the tech press writes about it and the only users are people who try everything, you’re at the 2.5%. When your aunt starts using it, you’re past the chasm. The second test: the five-year search interest curve in Google Trends. A fad has a spike and a drop; a trend climbs in steps. In 2012, the QR code looked like a fad nobody scanned; after 2020, thanks to restaurant menus and payments, it became something everyone takes for granted. The same goes for podcasts, covered in detail in the Media chapter.
The key word is adoption, not existence: video calls existed long before 2020. A trend isn’t born from an invention, but from the moment the majority changes its behavior. That’s why today we won’t ask “what’s new?” but “what have people started doing differently?”
Who adopts an innovation when (Rogers, 1962)
unit: %
- Innovators2.5%
- Early adopters13.5%
- Early majority34%
- Late majority34%
- Laggards16%
Two-thirds of people are the “majority”; marketing an innovation is first about the 16%, then about crossing the chasm to the next 34%.
data table
| Innovators | 2.5% | try everything |
|---|---|---|
| Early adopters | 13.5% | visionaries, opinion leaders |
| Early majority | 34% | pragmatists, want references |
| Late majority | 34% | skeptics, only when they have to |
| Laggards | 16% | tradition, last |
For discussion
Take one thing from the intro that you started using this year: is it a fad or a trend? Where is it on the Rogers curve right now?
Rabbit holes
- Diffusion of innovations (Wikipedia) ↗ · The whole theory: five categories, five attributes of an innovation, criticism.
- Crossing the Chasm (Wikipedia) ↗ · Why enthusiasts aren’t enough and how to get an innovation to the pragmatists.
- Google Trends ↗ · A five-year search interest curve tells a fad from a trend in a minute.
2How trends are predicted
Three independent signals confirm a trend
- ·Hype cycle: peak of expectations → trough of disillusionment → plateau
- ·The Economist: only about a fifth of technologies make it through the whole cycle
- ·Reports with data and the name of whoever paid: Reuters, Kantar, Bond
- ·Free signals: Google Trends, Similarweb, Wayback Machine, Ad Library
Predicting trends is a business. The best-known tool is Gartner’s hype cycle, proposed in 1995 by analyst Jackie Fenn. It has five phases: the technology trigger, the peak of inflated expectations, the trough of disillusionment, the slope of enlightenment and the plateau of productivity. A 2024 analysis by The Economist, cited by Wikipedia, found that only about a fifth of breakthrough technologies make it through the whole cycle, and six in ten of those that fall into the trough never recover. The curve doesn’t hold for every technology, but as a language for discussion it’s excellent.
The second source is trend reports. Read the ones that have data and say who paid for them: Reuters Digital News Report (every year, free, with a Czech chapter), Kantar Media Reactions (consumers and marketers in one survey) and Trends: Artificial Intelligence from the Bond fund (May 2025, 339 pages of charts on AI).
The third source is your own signals, and they’re free. Google Trends shows search interest over time and by region. Similarweb estimates your competitors’ traffic. Meta Ad Library and Google Ads Transparency show which ads competitors are running right now, and the Wayback Machine shows how their website has changed over ten years. When three independent signals point the same way (search interest is growing, competitors are buying ads, a report flags growth), you have a trend. When only one does, you have a headline.
How to read a report: methodology first (how many people, where, when, who paid), then the numbers, and the conclusions last. A software vendor that finds that 90% of companies need its software isn’t a source, it’s an ad. And write down the year next to every number: a report from 2020 is history today.
- 1 in 5
- technologies make it through the whole hype cycle (The Economist 2024)
- 6 in 10
- technologies in the trough of disillusionment never recover
- 339
- pages of charts on AI in the Bond report (May 2025)
Wikipedia: Gartner hype cycle
Wikipedia: Gartner hype cycle
Bond: Trends, Artificial Intelligence
Rabbit holes
- Gartner hype cycle (Wikipedia) ↗ · Five phases, the history and, above all, the criticism, including the Economist analysis.
- Reuters Digital News Report 2026 ↗ · The largest public survey of news consumption, with a Czech chapter.
- Kantar Media Reactions 2026 ↗ · What consumers think of channels and what marketers think; the gap is a trend in itself.
- Bond: Trends, Artificial Intelligence (May 2025) ↗ · 339 pages of charts on AI, the successor to Mary Meeker’s legendary Internet Trends.
3Adaptability: markets change like nature
Whoever adapts survives
- ·“The most adaptable survive” wasn’t Darwin, but Megginson (1963)
- ·Kodak and Blockbuster both knew the new thing; the old behavior still paid
- ·OODA: observe → orient → decide → act, faster than everyone around you
- ·Stable core (brand, website, relationships), mutating edges (formats, channels)
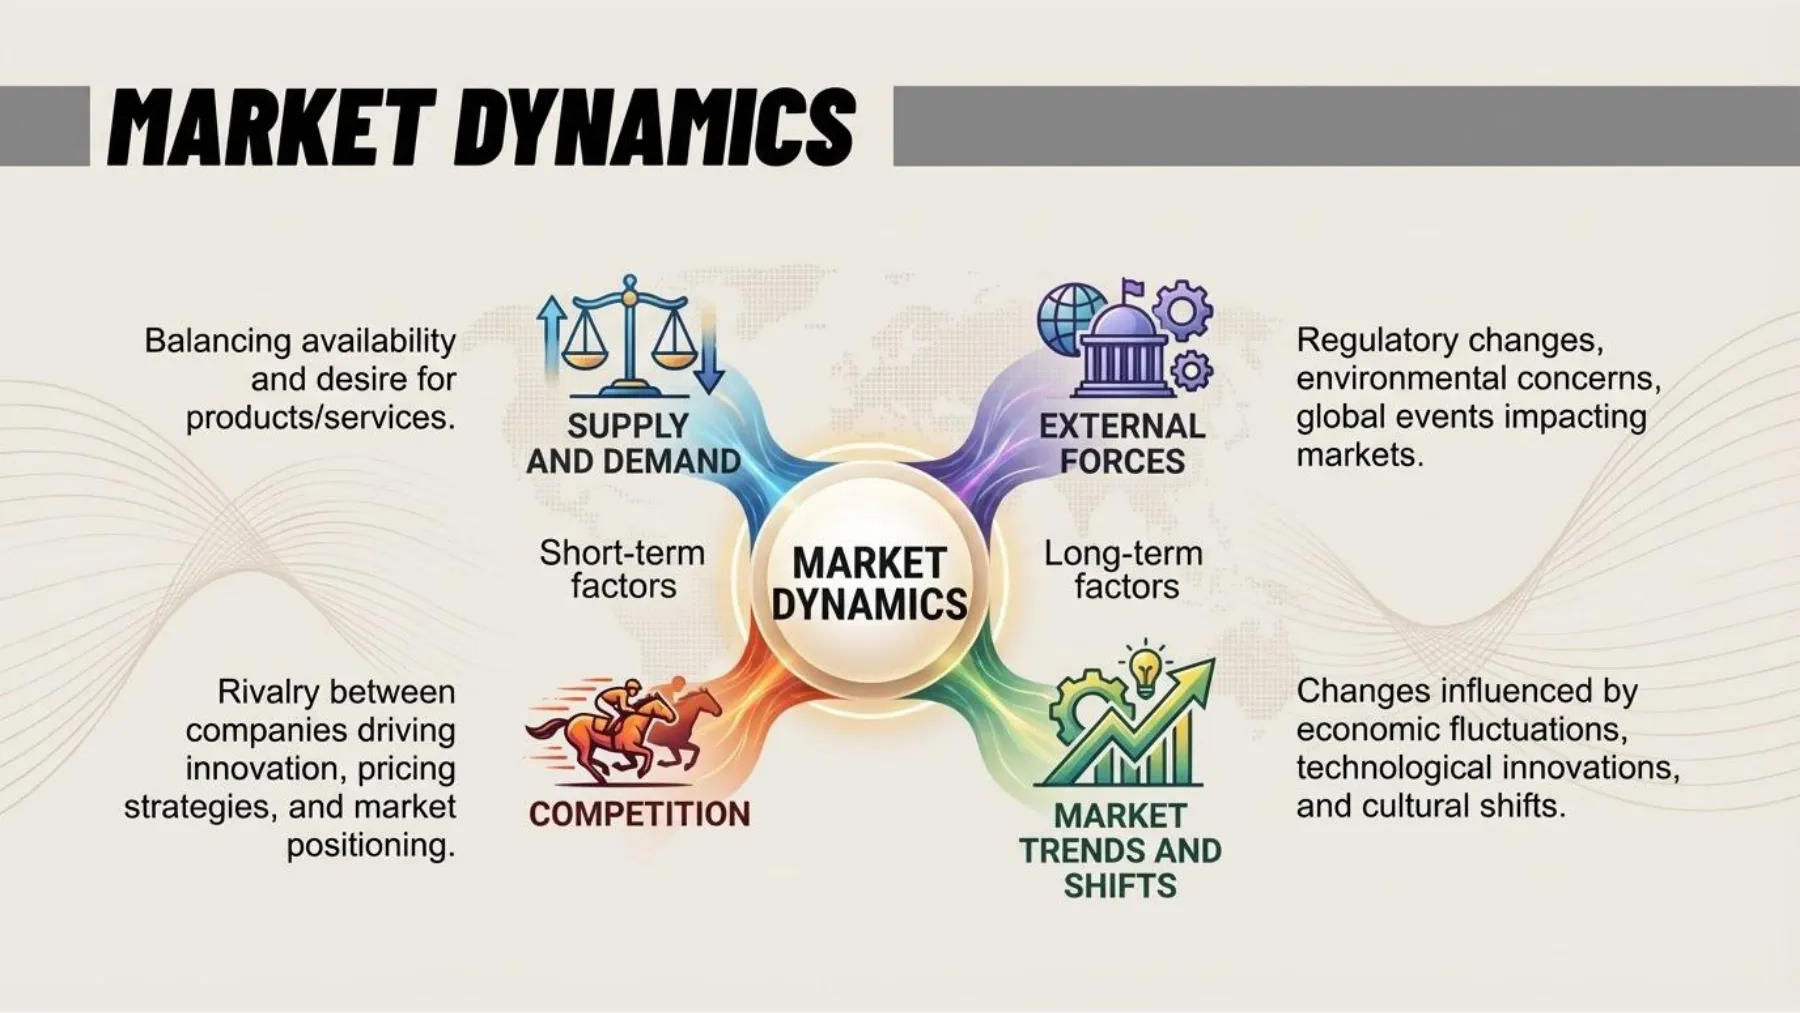
Natural scientists have a better model for markets than economists do: evolution. The environment changes, and species that don’t adapt die out; not because they’re weak, but because they were built for a world that ended. The famous quote “it’s not the strongest or the smartest who survive, but the one who adapts best to change” wasn’t written by Darwin, even though it’s attributed to him. According to Quote Investigator, management professor Leon C. Megginson said it in 1963 as his own interpretation of Darwin. But the idea holds: the market is the environment, and the company is a species.
Two textbook examples. Kodak: in 1975, its engineer Steve Sasson built the first portable, battery-powered digital camera. Before 1997, the company had an 80% share of the US film market; digital threatened its most profitable business, so it kept putting it off. On January 19, 2012, Kodak filed for bankruptcy protection. Blockbuster, which you know from the Marketing lesson, turned down buying a young Netflix for $50 million in 2000 and went bankrupt in 2010. Both had the new technology, and both knew about it. They didn’t change their behavior, because the old behavior still made money.
How do you adapt in a controlled way? With the OODA framework of US Air Force Colonel John Boyd from the early 1970s: observe, orient, decide, act, and again. Whoever runs the loop faster than the opponent “gets inside their decision cycle.” In marketing: measure every week, not once a year; always keep small experiments running; decide on last week’s data, not last year’s survey.
From the Marketing chapter, recall the two kinds of innovation: incremental (a better camera in your phone) and disruptive (streaming instead of DVDs, the phone instead of the camera). Every company can handle incremental innovation; disruptive innovation kills the one with the most to lose. A framework for you: keep the core stable (brand, website, relationships), let the edges mutate (formats, channels, tools), and when an edge starts earning more than the core, move it inside before your competitors do.
- 1975
- Kodak built the first digital camera; bankruptcy on January 19, 2012
- $50 million
- the price at which Blockbuster turned down buying Netflix in 2000
Wikipedia: Kodak
Wikipedia: Blockbuster
For discussion
Which company around you (a club, a brand, a store) could face Kodak’s fate today? What does it know is coming, and why is it putting it off?
Rabbit holes
- Quote Investigator: adapt ↗ · A detective story about how a sentence from 1963 became Darwin.
- OODA loop (Wikipedia) ↗ · Boyd’s loop and why speed of decision beats strength.
- Kodak (Wikipedia) ↗ · Sasson in 1975, an 80% share and bankruptcy in 2012, all in one story.
4Geopolitics and markets
When governments change the market
- ·Platform: TikTok in the US, 2024 law, half-day shutdown, sale in 2026
- ·Price: average US tariff 16.9% in January 2026, the highest since 1932
- ·Rules: most AI Act obligations apply from August 2, 2026
- ·Cookies are staying in Chrome after all; the “cookieless world” never came
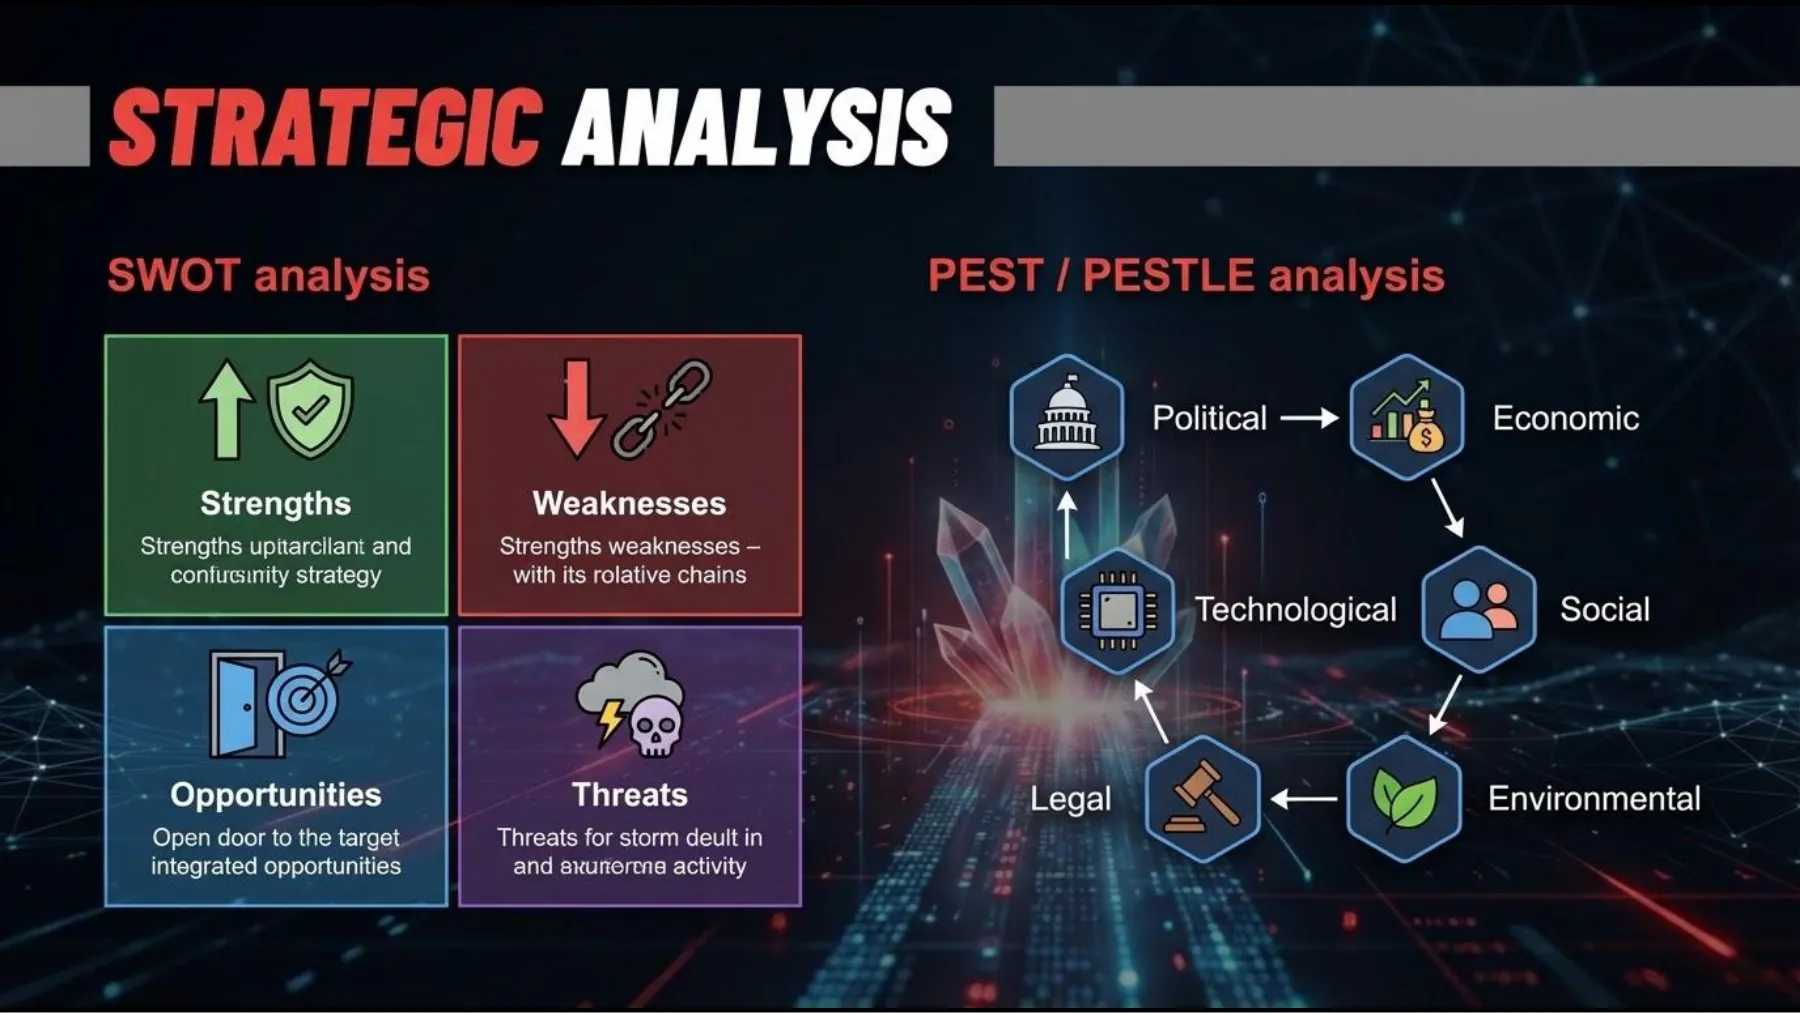
Markets aren’t changed only by customers and technology, but also by governments. For a marketer, this takes three forms: the platform you stand on can be banned or sold; the rules for data, advertising and AI change across entire continents; and tariffs and supply chains change prices, the availability of goods and where it pays to sell. This is part of the PEST analysis from the Marketing chapter. Three examples from the last two years:
TikTok in the US. A law signed on April 24, 2024, ordered ByteDance to sell the US business by January 19, 2025. The app went dark in the US on the evening of January 18 and came back at noon the next day, after a promise of a delay. On January 22, 2026, TikTok USDS was formed: Oracle, Silver Lake and MGX with 15% each, ByteDance with 19.9%. The lesson from the Internet chapter: your own website and email list are the only channels nobody can switch off for you.
Tariffs. On April 2, 2025, the US announced “reciprocal” tariffs on almost every country, with a minimum of 10%. According to the Yale Budget Lab, Americans paid an average tariff of 16.9% in January 2026, the highest since 1932. On February 20, 2026, the US Supreme Court struck down the tariffs based on the IEEPA law; the administration replaced them with others, and in August 2026 the average rate was 11.0%. Rules for AI and data in the EU. The AI Act is phasing in step by step, and most obligations apply from August 2, 2026; the Artificial Intelligence lesson covers the exact timeline and the later delays. And on April 22, 2025, Google announced that it won’t remove third-party cookies from Chrome.
What can you do about it? Don’t try to predict politics; build so that it doesn’t catch you off guard: own your audience (website, email, database), have at least two channels, keep data in the EU, and go through a one-page PEST once a quarter. For a marketer, geopolitics is weather: you can’t influence it, but you can have a roof.
- 19.9%
- ByteDance’s stake in TikTok USDS since January 22, 2026
- 16.9%
- average US tariff in January 2026, the highest since 1932; 11.0% in August
- August 2, 2026
- the date from which most AI Act obligations apply
Wikipedia: Restrictions on TikTok in the US
Yale Budget Lab
artificialintelligenceact.eu
Rabbit holes
- EU AI Act: Implementation timeline ↗ · The exact dates of what applies when.
- Restrictions on TikTok in the United States (Wikipedia) ↗ · From the law to the shutdown to TikTok USDS.
- Yale Budget Lab: The State of U.S. Tariffs ↗ · A regularly updated average US tariff rate and what it costs households.
- Privacy Sandbox: Next steps (April 22, 2025) ↗ · The announcement that third-party cookies are staying in Chrome.
5What marketing is using right now
People are on social media and click less
- ·News: social and video 54%, TV 52%; narrow, but ahead of TV for the first time
- ·Google AI summary: link clicks 8% instead of 15% (Pew)
- ·Vertical video, video podcasts, newsletters, retail media, events
- ·Sustainability backed by data, personalization from your own data
- ·Czechia: YouTube 8.1 million, Facebook 5.0 million, TikTok 2.1 million adults
Ask “what is marketing using right now,” and you’ll get a list of tools. A better question is “where are people, and whom do they trust?” The Reuters Digital News Report 2026 (48 markets, 97,520 people) found for the first time that social media and video are the most common route to news: 54%, TV 52%. A two-point gap is narrow, and the authors advise reading it with caution. Trust in news fell to 37%, the lowest since 2015, and 10% of people use AI chatbots for news every week (7% last year). That gives us the first trend: creators and social formats instead of media, covered in detail in the Media and Social Media chapters.
The second trend: zero-click search. In March 2025, Pew Research tracked the actual Google searches of 900 Americans. An AI summary appeared for 18% of queries. When it did, users clicked a traditional link in only 8% of cases (15% without a summary) and ended the search right there in 26% (16% without a summary). The result: fewer visits from search, and a new discipline, writing so that AI cites you, called generative engine optimization (GEO). The third trend: first-party data. The industry has learned to collect emails and logins; newsletters are back, and in March 2025 Substack reported 5 million paid subscriptions. Personalization is built on your own data, too: offers based on what customers bought or read from you, not on someone else’s cookies.
The fourth trend: short vertical video everywhere (TikTok, Reels, Shorts, LinkedIn); the fifth, video podcasts (the Streaming chapter); the sixth, retail media: advertising directly in retailers’ online stores and apps. Seventh: events as content factories (the Events chapter). Eighth: sustainability backed by data, not a slogan. Since September 27, 2026, Directive 2024/825 has applied in the EU: generic claims such as “eco-friendly” or “green” without proof, and self-made “eco” labels without certification, are banned (overview).
And above it all, AI: according to Kantar, a net 75% of marketers plan to increase investment in AI assistants in 2027, while only 23% of consumers trust their recommendations. Kantar says “net,” which usually means the share of those who will increase investment minus the share of those who will cut it. That gap between marketers and people is a trend in itself.
According to DataReportal (data from October 2025), Czechia has 9.96 million internet users (94% of the population) and 8.08 million social media user identities. Ads can reach 8.08 million people on YouTube (the same number, by coincidence), 5.00 million on Facebook, 3.95 million on Instagram, 3.20 million on LinkedIn, 2.13 million adults on TikTok, 1.54 million on Snapchat and 1.13 million on X. Facebook isn’t dead in Czechia; it’s second after YouTube. TikTok reaches a quarter of adults, not “all young people.”
- 54%
- of people get news from social and video, 52% from TV: narrowly, but for the first time
- 8%
- link clicks with an AI summary in Google; 15% without one
- 5 million
- paid newsletter subscriptions on Substack (March 2025)
Reuters Digital News Report 2026
Pew Research Center, 2025
Wikipedia: Substack
How many people in Czechia ads can reach on each platform
unit: million
YouTube and Facebook remain the largest; TikTok counts only adults, LinkedIn all registered members.
data table
| YouTube | 8.1 million | 76% of the population |
|---|---|---|
| 5 million | 47% of the population | |
| 4 million | 37% of the population | |
| 3.2 million | registered members | |
| TikTok | 2.1 million | 18+ only, 25% of adults |
| Snapchat | 1.5 million | |
| X | 1.1 million |
Rabbit holes
- Pew Research: AI summaries and clicks (2025) ↗ · A study of the actual behavior of 900 people, not a questionnaire.
- DataReportal: Digital 2026 Czechia ↗ · All the Czech numbers on the internet and social media in one place, free.
- Reuters Digital News Report 2026 ↗ · Social media ahead of TV, trust at a low, AI chatbots for news.
- Substack (Wikipedia) ↗ · How a newsletter became a business with 5 million paid subscriptions.
6Simplicity as a trend (KISS)
KISS: fewer tools, more work done
- ·Martech: 150 tools (2011) → 15,505 (2026), growth has stopped
- ·Boring technology: a company has only about 3 innovation tokens
- ·My media-monitor: 68 emails in 26 days, one useful every 2–3 weeks
- ·One website, one newsletter, one or two social networks done properly
The strongest trend of recent years isn’t a tool, it’s tool fatigue. Since 2011, Scott Brinker has been counting the marketing technologies on the market: from 150 products in 2011 to 15,384 in 2025 and 15,505 in 2026. This year, for the first time, growth practically stopped (+0.79%), and Brinker writes about “peak martech.” For every part of the job there are dozens of options, and choosing alone takes more time than the work itself. The answer is an old one: KISS, keep it simple, stupid. In digital strategy, that means one website, one newsletter, one or two social networks done properly, one typeface, one message. People read the first line and skim the rest.
Engineering says the same thing as “boring technology” (Choose Boring Technology, by Dan McKinley of Etsy and Mailchimp): every company has only about three innovation tokens it can spend on something new and unproven; everything else should stand on things whose failure modes you know. In marketing: spend a token on AI or on a new format, not on a new CRM, a new website and a new agency in the same year. A new tool is easy to add and hard to run.
Simplicity is also an approach to the customer’s attention. It used to be “the more notifications, the better.” Today, a message from a brand that’s worth reading is rare, and sending noise is expensive: people unsubscribe, and you can’t reach them again. The measure of a newsletter isn’t how many you sent, but how many people still open it a year later. The same goes for websites: a static page doesn’t break; more in the Internet chapter.
- 15,505
- marketing tools on the market in 2026; in 2011 there were 150
- +0.79%
- growth in the number of tools in 2026: practically zero for the first time
- 3
- innovation tokens a company can spend on unproven technology
chiefmartec.com
chiefmartec.com
Dan McKinley: Choose Boring Technology
For discussion
How many apps do you have on your phone, and how many did you open this week? Which three would be enough for 90% of what you do?
Rabbit holes
- chiefmartec: 2026 Marketing Technology Landscape ↗ · The supergraphic with 15,505 logos and a look at why growth stopped.
- Choose Boring Technology ↗ · Three innovation tokens; worth reading as a marketer, too.
7Tools and where to find inspiration
Three sources, not thirty
- ·Reddit, Hacker News, Product Hunt: what annoys people, what excites techies
- ·One good industry newsletter replaces ten websites
- ·Borrow the format from elsewhere: NFL club → HOPI warehouses
- ·Before buying: export? yearly cost? where’s the data? can I already do this?
- ·If you can’t take your data with you, the tool owns you, not the other way around
How do you follow trends without going crazy? Have three sources, not thirty, and read them regularly. Reddit (since 2005, 121.4 million daily users in 2025): forums where people write about what doesn’t work. Hacker News (since 2007): what techies consider important shows up in marketing two years later. Product Hunt (November 2013, bought by AngelList for $20 million in 2016): new tools every day, ranked by votes; great for an overview, terrible for choosing, and most disappear within a year. And newsletters on Substack or Beehiiv: one good industry newsletter replaces ten websites.
The best idea often doesn’t come from competitors, but from another industry or another country. Don’t copy the content; borrow the format: the way something is filmed, written or built. Sports clubs or tech companies often try new formats before B2B companies do; what works there can be carried over into an industry where nobody has used it yet.
How do you choose a tool when five new ones appear every week? The four questions are in the list below the text. If you answer yes to the last one, don’t buy the new tool.
For reference, here’s my stack, as an example that you can work with very little: Claude Code (websites, scripts, agents), artifacts on claude.ai (overviews, run sheets), Midjourney and Higgsfield (images and video), Photopea, Squoosh and remove.bg (free editing in the browser), Adobe Express, Google Workspace, Trello, Umami (analytics without cookies), 1Password. For verification: Wayback Machine, Similarweb, Google Trends, Meta Ad Library, Google Ads Transparency, Atlas Čechů, ARES, Hlídač státu, TinEye, PageSpeed. More in the Internet and Production chapters.
- -Export: can I take my data with me in an open format (CSV, JSON, HTML), or is it locked in?
- -Yearly cost, and after a price hike: what happens to the budget if the plan gets 50% more expensive?
- -Where is the data: the EU or the US? Whose server? What does the data processing agreement say?
- -Duplication: can a tool I already have do the same thing?
- 121.4 million
- daily Reddit users in 2025
- $20 million
- what AngelList paid for Product Hunt in 2016
- 2007
- Hacker News launched (Paul Graham, Y Combinator)
Wikipedia: Reddit
Wikipedia: Product Hunt
Wikipedia: Hacker News
For discussion
Find a video or campaign from a completely different industry or country, sports included, and carry the format over to your club or brand. What do you keep, and what do you have to change?
Rabbit holes
- Miami Dolphins: Drone Tour (2021) ↗ · A drone fly-through of an NFL club’s training facility, 3:08.
- HOPI Frozen Logistics Tour 2025 ↗ · The same format in temperature-controlled warehouses, 1:35.
- Hacker News ↗ · What techies consider important; in two years, it’ll be in marketing.
- Product Hunt ↗ · New tools every day; look, don’t buy.
8Automation: Zapier, Make, n8n
When A happens, do B
- ·Zapier: the simplest, 9,000+ apps, 100 free tasks a month
- ·Make: visual scenarios, 1,000 free credits a month
- ·n8n: free on your own server, your data stays with you
- ·Do it by hand ten times first; automate what you do the same way 3× a week
- ·Every workflow has an owner and a watchdog, or it fails silently
Automation is a “when A happens, do B” rule that runs without a human: a form comes in → write it to a spreadsheet → send a confirmation → create a Trello card. Three no-code tools can do this; there’s an overview below the text. Zapier is the simplest; n8n is for those who want to keep their data in-house. Before you buy a tool, go through the four questions from the previous section.
What to automate: anything you do the same way three times a week that has a clear input and output. Sign-ups from the website into the CRM, confirmation emails, a weekly analytics report into chat, new article → LinkedIn post, an alert when the website goes down. What not to automate: anything that requires judgment, or where a mistake costs your reputation (a reply to a journalist, crisis communication, the price in a quote). The rule: do it by hand ten times first and write down the steps. What you can’t describe, you can’t automate.
What goes wrong: automations fail silently. An API changes, a token expires, a spreadsheet gets a new column, and the workflow sends empty emails for three weeks. That’s why every workflow needs a watchdog (an alert when it didn’t run) and an owner (a person’s name, not a department). The cost isn’t just the subscription but also maintenance: count on roughly an hour a month for every running workflow.
- -Zapier: the simplest, 9,000+ apps. 100 free tasks a month; the Professional plan starts at $19.99 a month, billed annually.
- -Make (originally Integromat, from Czechia): visual scenarios, 3,000+ apps. 1,000 free credits a month.
- -n8n: fair-code (the code is public, commercial use comes with conditions), 207k stars on GitHub. Cloud from €20 a month for 2,500 executions; free on your own server.
- 9,000+
- apps Zapier connects; 100 free tasks a month
- €20
- a month for n8n Cloud Starter with 2,500 executions (billed annually); free on your own server
- 207k
- stars for n8n on GitHub (October 2026)
zapier.com/pricing
n8n.io/pricing
github.com/n8n-io/n8n
Rabbit holes
- Zapier: pricing ↗ · What’s free and what 750 tasks a month cost.
- Make: pricing ↗ · Credits instead of tasks; 1,000 free a month.
- n8n: pricing ↗ · Cloud from €20, or run it yourself.
- n8n on GitHub ↗ · Source code, license and 207k stars.
9Custom GPTs and Claude projects
You don’t train a custom GPT, you brief it
- ·GPTs (OpenAI, November 2023) and Claude projects (June 2024)
- ·Instructions + knowledge + tools; the model stays the same
- ·A Claude project holds roughly 500 pages of material
- ·Developers: 84% use AI, only 33% trust it (Stack Overflow 2025)
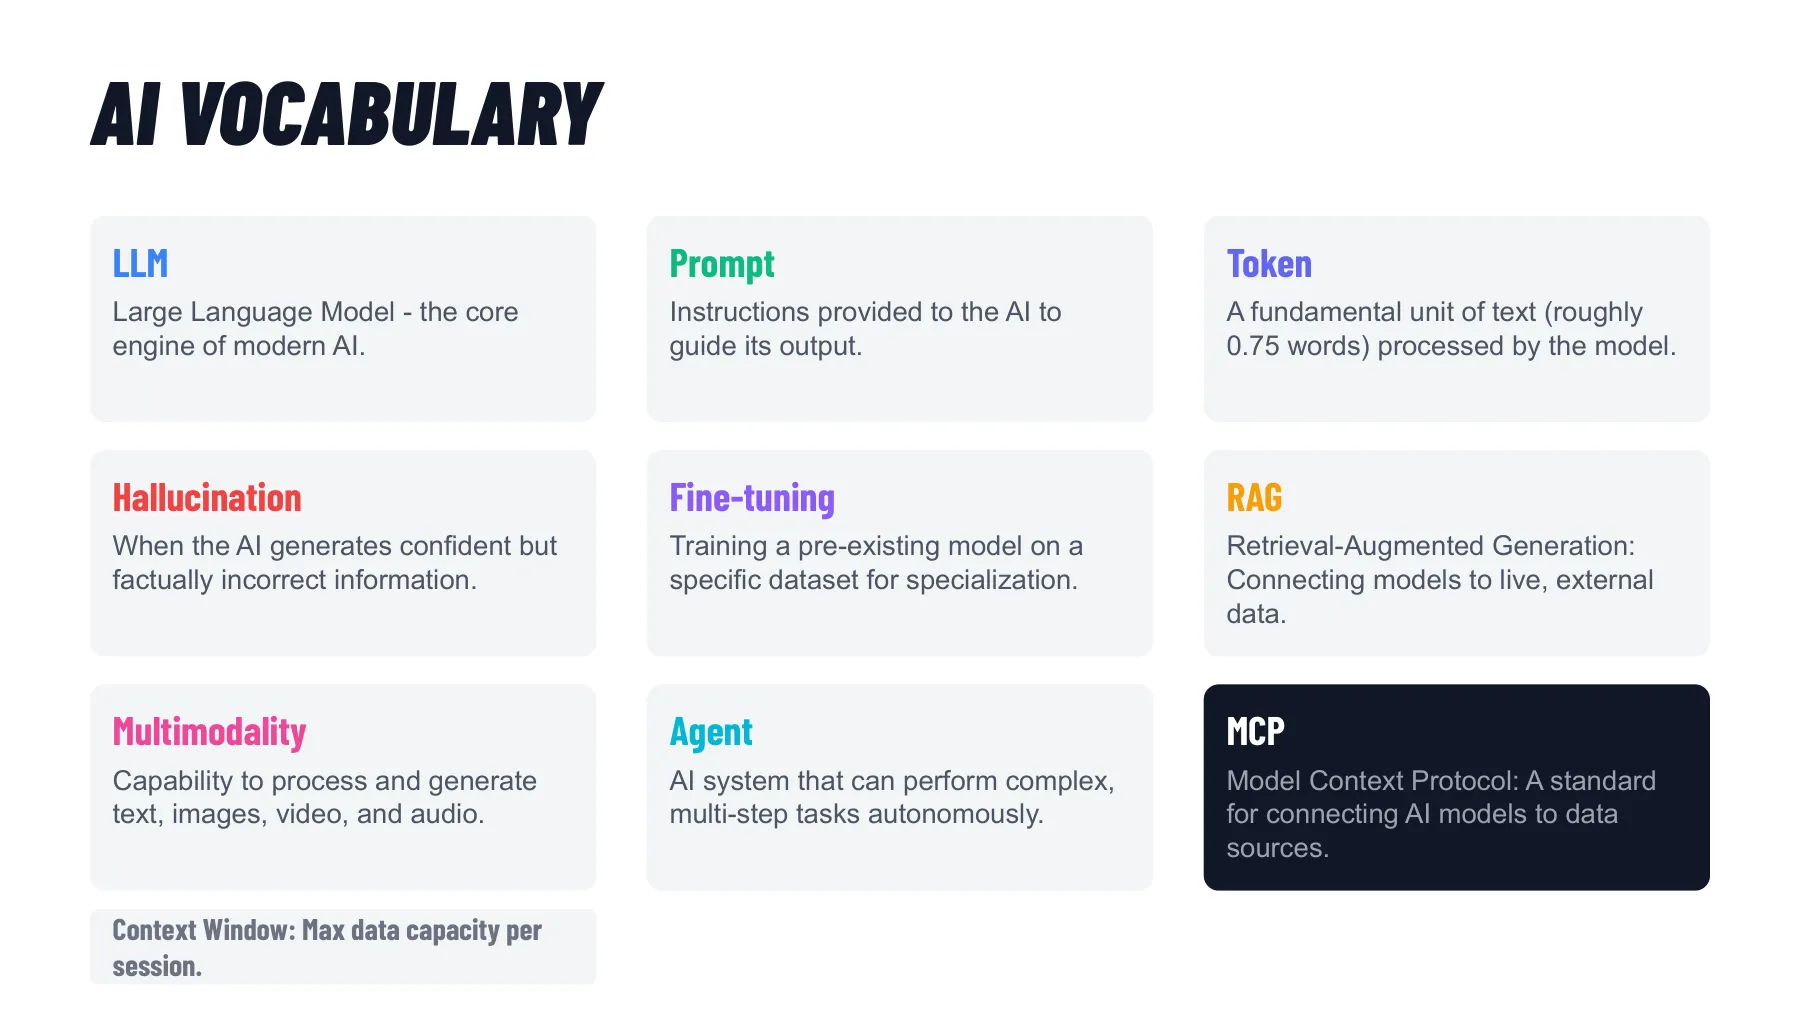
“Training your own AI” is the most common wish of marketing teams, and also a misunderstanding. Neither a custom GPT nor a Claude project trains the model. You give it instructions (who it is, how it talks, what it must not do), knowledge (files it draws from) and possibly tools (web, spreadsheets, APIs). The model stays the same; the brief changes. OpenAI introduced GPTs on November 6, 2023, and opened the GPT Store in January 2024; according to Wikipedia, the pharmaceutical company Moderna created 750 internal GPTs. Anthropic added Projects on June 25, 2024: each project has a context window of 200,000 tokens, roughly 500 pages, with its own instructions and knowledge. According to the pricing page (October 2026), you get up to 5 projects for free, and the Pro plan costs $20 a month ($17 billed annually).
The list below the text sums up what belongs in a project and what doesn’t. One more rule: a project is a document like any other; someone owns it and updates it once a quarter.
How much should you trust it? In 2025, Stack Overflow asked developers: 84% use AI or plan to, but only 33% trust the accuracy of its output and 46% don’t. The biggest frustration (66%): answers that are “almost right, but not quite.” That’s exactly the risk of a marketing GPT: a press release that sounds good and has the wrong date. That’s why you should test every assistant on ten real tasks.
- -Instructions: who the assistant is, who it writes for, tone, length, what it must never do (promises, numbers without a source).
- -Knowledge: the brand manual (the Brand chapter), tone of voice with examples of good and bad sentences, a press release template, product facts, FAQs, banned words, the 10 best outputs.
- -Test: ten real tasks, the output side by side with a human’s; fix whatever is “almost right” in the instructions.
- -Never: passwords, personal data, contracts, internal figures that must not get out.
- 200,000
- tokens of context in a Claude project, roughly 500 pages
- 33%
- of developers trust the accuracy of AI output; 46% don’t
- 66%
- name “almost right” answers as their biggest frustration
Anthropic, June 2024
Stack Overflow Developer Survey 2025
Stack Overflow Developer Survey 2025
Rabbit holes
- Anthropic: Projects ↗ · The announcement from June 25, 2024: what a project can do and who it’s for.
- OpenAI: Introducing GPTs (November 6, 2023) ↗ · The original announcement: instructions, knowledge and capabilities instead of programming.
- Stack Overflow Developer Survey 2025: AI ↗ · The most honest numbers on trust in AI, from people who use it every day.
- Claude: pricing ↗ · What’s free, and what Pro and Max include.
10Hardware: VR, smart glasses, wearables, LED walls
Glasses and rings are further along than VR
- ·VR: $3,699 shows what the technology can do; $299, what people will buy
- ·Meta glasses: camera 2023, display 2025, $299 in 2026
- ·Oura ring: 5.5 million sold, wearables have crossed the chasm
- ·LED walls instead of projectors and green screens
- ·Esports: tournaments the size of stadiums; gaming is covered in the Streaming chapter
Virtual reality is the hype cycle in action: a peak of expectations, a long trough and, today, two poles of the market. Apple Vision Pro at $3,499 (on sale in the US since February 2, 2024; it has cost $3,699 since June 2026) and Meta Quest 3S at $299 (since October 15, 2024). The expensive headset shows what the technology can do; the cheap one, what people actually buy. For marketers, VR is still a niche: trade fairs and showrooms (a tour of a warehouse that hasn’t been built yet), not mass reach.
More interesting are smart glasses. Ray-Ban Meta (October 2023) have a camera, microphones and an AI assistant in ordinary frames. Meta Ray-Ban Display (on sale since September 30, 2025, $799 including the Neural Band wristband) added a small color display in one lens and gesture control from the wrist. In June 2026, Meta Glasses arrived at $299. If glasses become what the phone was, the content format will change: audio and short text in front of your eye, not a feed. For now, they’re at the early adopter stage of the Rogers curve, but keep an eye on them. Augmented reality (AR), on the other hand, is mainstream; it just isn’t called that: filters on Instagram and Snapchat, trying on glasses or furniture in an online store through your phone’s camera.
Wearables have crossed the chasm: Finland’s Oura sold 2.5 million rings by December 2024 and 5.5 million by September 2025. The Oura Ring 4 (since October 2024) costs €379 in Europe and from $349 in the US, and needs a subscription for full functionality. In October 2025, the company raised $900 million at a valuation of about $11 billion. For sports and health, it’s a gold mine of data (sleep, heart rate, strain). Watch out for GDPR: health data is a special category, and using it for marketing requires explicit consent.
LED walls have changed both stages and film studios. Sphere in Las Vegas (opened September 29, 2023, $2.3 billion): inside, a 16K-resolution screen with an area of 15,000 m². In film, the LED wall replaced the green screen: for the series The Mandalorian (2019), ILM built the “Volume,” with backgrounds rendered in real time. At conferences, an LED wall is now the standard instead of a projector: brighter, no shadows, but expensive, and it needs content in the wall’s native resolution. And esports as the new stadium: the Esports World Cup 2025 in Riyadh paid out $71.5 million in prize money across 26 tournaments; gaming and Twitch are covered in the Streaming chapter.
- $3,499
- Apple Vision Pro at launch in February 2024; Quest 3S $299
- 5.5 million
- Oura rings sold by September 2025 (2.5 million by December 2024)
- $2.3 billion
- the cost of Sphere in Las Vegas; 15,000 m² of screen inside
- $71.5 million
- total prize money at the Esports World Cup 2025 in Riyadh
Wikipedia: Apple Vision Pro, Meta Quest 3S
Wikipedia: Oura Health
Wikipedia: Sphere
Wikipedia: 2025 Esports World Cup
Rabbit holes
- Sphere (Wikipedia) ↗ · The numbers behind the world’s largest LED sphere.
- StageCraft (Wikipedia) ↗ · How an LED wall and a game engine replaced the green screen.
- Apple Vision Pro (Wikipedia) ↗ · Prices, sales and versions since 2024.
- Meta: Introducing Meta Ray-Ban Display ↗ · Glasses with a display and a wristband for $799.
11Digital detox and attention
Attention: the scarcest resource
- ·World: 6.04 billion people online, over 2.5 hours a day on social and video
- ·Czechia: Gen Z spends 223 minutes a day on social media, boomers 92
- ·Australia since December 2025: social media only from age 16
- ·US: nearly half of teens are online “almost constantly”
There are 6.04 billion internet users in the world (73% of humanity) and 5.66 billion social media user identities. Internet users aged 16 to 64 spend over an hour a day on classic social networks, and about 2 h 39 min a day including video platforms like YouTube and TikTok, which is 18 hours 36 minutes a week (DataReportal, Digital 2026). In Czechia, the AMI Digital Index 2026 (1,013 people aged 15 and over, fieldwork in May 2026) breaks this down by generation: Gen Z 223 minutes a day, and 95% of them open social media every day; millennials 139 minutes (152 last year), Gen X 110 (up from 106), boomers 92 (up from 88). For marketers: attention is the scarcest resource, and you compete for it with everyone who has an app.
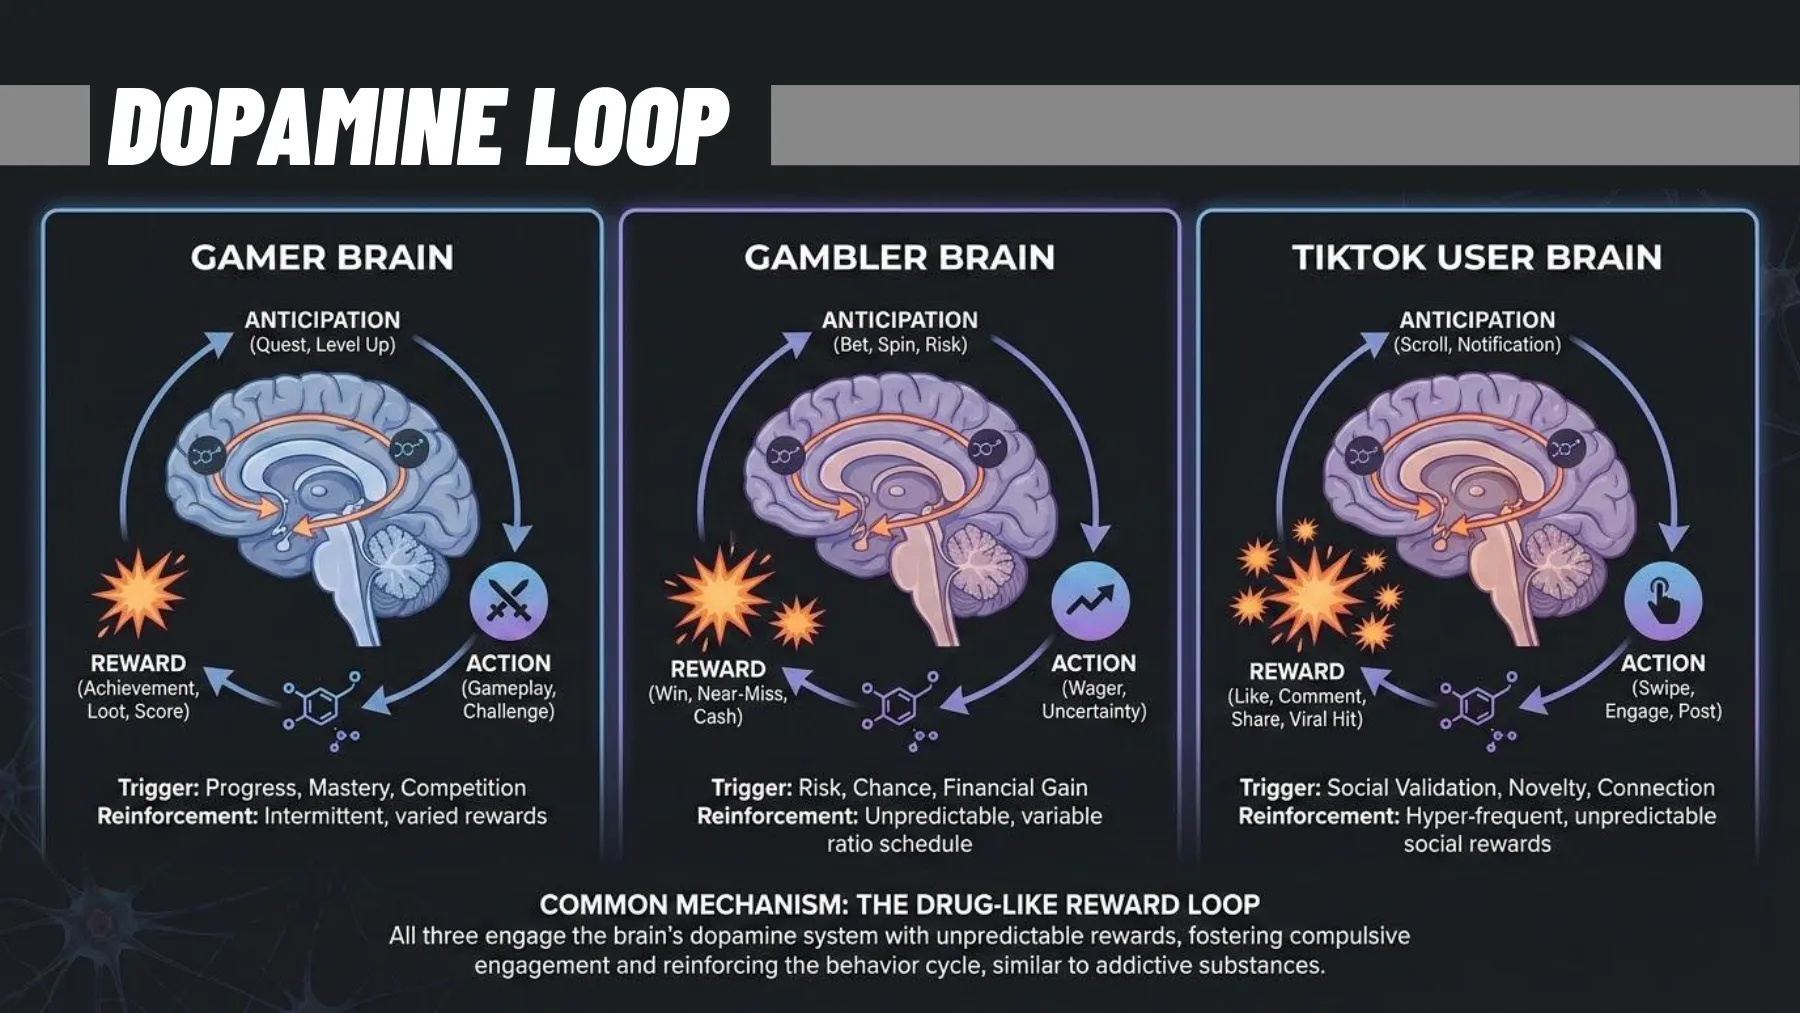
The countertrend is just as strong. Since December 10, 2025, Australia has banned social media accounts for people under 16 (including Facebook, Instagram, TikTok, YouTube and X), with fines for platforms of up to 49.5 million Australian dollars; according to Wikipedia, getting around the ban is common, but the precedent stands. In fall 2024, the US Pew Research Center found (1,391 teens aged 13 to 17) that nearly half of them are online “almost constantly”; 90% use YouTube, about 60% TikTok and Instagram, 55% Snapchat. Feature phones, focus modes, phone-free schools: people are taking their attention back. Why this is so hard is explained by the dopamine loop in the Social Media chapter.
What this means for communication: less, but better. Limit how often an ad is shown (frequency capping), send the newsletter only when you have something to say, don’t turn on notifications by default, and measure unsubscribes as seriously as opens. Brands that respect people’s peace get attention when they ask for it. And for each of you personally: notifications off except from people, phone out of the bedroom, one morning a week without a screen. It’s a work skill, not magazine advice. This lesson is 90 minutes long; be honest, how many times have you looked at your phone during it?
- 223 min
- a day on social media for Czech Gen Z (May 2026)
- Age 16
- minimum age for a social media account in Australia since December 10, 2025
- A$49.5 million
- maximum fine for a platform that doesn’t enforce the age limit
- 18 h 36 min
- a week on social and video for internet users aged 16–64
AMI Digital Index 2026
Wikipedia: Online Safety Amendment Act 2024
Wikipedia: Online Safety Amendment Act 2024
DataReportal, Digital 2026
Minutes a day on social media in Czechia by generation (2026)
unit: min
Gen Z spends 2.4× as much time on social media as boomers; millennials are the only ones whose time fell year over year (152 → 139).
data table
| Gen Z | 223 min | 95% open social media every day |
|---|---|---|
| Millennials | 139 min | 152 last year |
| Gen X | 110 min | 106 last year |
| Boomers | 92 min | 88 last year |
For discussion
How much time have you spent on your phone today? Open Screen Time or Digital Wellbeing and compare it with Gen Z’s 223 minutes. Who’s above average?
Rabbit holes
- AMI Digital Index 2026 ↗ · Czech numbers by generation, every summer (in Czech).
- DataReportal: Digital 2026 Global Overview ↗ · Global numbers on the internet, social media and time online.
- Online Safety Amendment (Social Media Minimum Age) Act 2024 (Wikipedia) ↗ · Australia’s under-16 ban: what applies, to whom, and how people get around it.
- Pew Research: Teens, Social Media and Technology 2024 ↗ · What American teens do online, with the methodology.
12Management and principles that outlast trends
Trends are a radar, not a steering wheel
- ·Goals and audiences change slowly, channels and forms fast
- ·Cadence: weekly retro, quarterly tool review, yearly plan
- ·Experiments: a tenth of your time, an owner, a review date
- ·Empathy with direction: understand people, but lead them
- ·Never straight to production: try a trend on a small audience first
Trends are a radar, not a steering wheel. The goal (what you want) and the audience (who it’s for) change slowly; tools and formats change fast. Of the six steps of digital strategy (goal → audience → message → channel → form → result, the Internet chapter), trends mainly affect channel and form. If you change your goal to follow a trend, you don’t have a strategy, just a feed. Running a team rests on cadence: a 30-minute retrospective every week, a tool review every quarter (what to cut, not what to add), a plan every year. Experiments get a budget (roughly a tenth of your time), an owner and a review date: after that, either into the core or cancel.
The principles that outlast trends are as old as trade itself: listen more than you talk; a relationship is more than a transaction, because trust pays interest; prepare, but read the room; people can tell when you don’t mean it; and empathy with direction: understand what people want, but lead them; don’t just repeat their wishes back. From this lesson, add: own your audience, have two channels, manual first and then automate, fewer tools, respect attention. None of this will go out of date, because it’s not about technology, it’s about people.
And one last principle from software development that works for marketing, too: never straight to production. Every change goes first to a test branch, then to a test environment (staging), and only after approval into live operation. Translated: try a new trend on a small audience first (one newsletter, one event, one month), measure it, and only then put it in your annual plan. The whole course in one sentence: marketing is a system, and AI is rewriting every layer of it right now; if you understand the system, you also understand what’s changing in it.
- -Quarterly review: a list of all subscriptions and tools, who owns them, what they cost per year.
- -When did we last use it? Anything that hasn’t been opened in three months goes.
- -Can the data be exported? If not, plan your exit while it’s still cheap.
- -What are two tools doing twice? Cancel one.
For discussion
What trend would you recommend that your club or brand try this year, which one would you leave alone, and how would you know within a month that you got it wrong?
For the exam
Terms
- -Fad, trend, megatrend: a fad lasts weeks, a trend years, a megatrend decades; you invest a campaign in a fad, a channel and people in a trend, and a strategy in a megatrend.
- -Rogers’ curve and the chasm: people adopt an innovation in stages, from innovators through early adopters and the majority to laggards, and between early adopters and the early majority lies the chasm where most innovations end up.
- -Hype cycle: Gartner’s curve with five phases, from the technology trigger through the peak of inflated expectations and the trough of disillusionment to the slope of enlightenment and the plateau of productivity.
- -Adaptability framework: keep the core (brand, website, relationships) stable, let the edges (formats, channels, tools) mutate, and run the OODA loop (observe, orient, decide, act) faster than the competition.
- -Custom GPTs and Claude projects: they don’t train the model; they give it instructions, knowledge and possibly tools, so the model stays the same and the brief changes.
Numbers
- -2.5 / 13.5 / 34 / 34 / 16%: innovators, early adopters, early majority, late majority and laggards (Rogers, 1962)
- -8%: link clicks when Google shows an AI summary; 15% without one (Pew Research Center, 2025)
- -223 min: a day on social media for Czech Gen Z (AMI Digital Index 2026)
The final exam is online in the last lesson, in English: 30 questions with three options each from the whole course, and you need 80% to pass. It asks about the terms in the For the exam boxes and how to apply them, much like the quizzes at the end of each lesson.
Final quiz
1The five-year Google Trends search interest curve for a new video format shows one sharp spike last year and a drop ever since. What does that mean for a club?
- a)Likely a trend: the spike means the majority adopted it, so plan for it
- b)Likely a fad: worth one campaign at most, not a yearly plan
- c)Likely a megatrend: interest this sharp changes behavior for decades
answer
b) Likely a fad: worth one campaign at most, not a yearly planOn a five-year curve, a fad has a spike and a drop while a trend climbs in steps, and you invest a campaign in a fad, not a yearly plan (section 1)2A club software vendor publishes a report: 90% of clubs need a new membership management system. What do you do with the report first?
- a)Check the methodology: how many people, where, when, who paid
- b)Read the conclusions and check numbers only where they seem off
- c)Compare its numbers with the same vendor’s report from last year
answer
a) Check the methodology: how many people, where, when, who paidA report is read from methodology to numbers to conclusions, and a vendor that finds everyone needs its software isn’t a source, it’s an ad (section 2)3A club’s fan community lives entirely on one social network that may be banned in the country. According to the lesson, what’s the best insurance?
- a)Follow the news and move once the ban is certain
- b)Move the community to another network that isn’t at risk
- c)Move fans over to your own website and email list
answer
c) Move fans over to your own website and email listYour own website and email list are the only channels nobody can switch off for you, and rather than predicting politics, you build so that it doesn’t catch you off guard (section 4)4A club wants website sign-ups written to a spreadsheet automatically, with a confirmation email sent to each applicant. What do you do first?
- a)Pick the tool that connects the most apps
- b)Do it by hand ten times and write down the steps
- c)Build the workflow and debug it on live sign-ups
answer
b) Do it by hand ten times and write down the stepsThe rule is to do it by hand ten times first and write down the steps, because what you can’t describe, you can’t automate (section 8)5A Claude project writes the club’s press releases, and one of them had the wrong match date. How do you fix it?
- a)Write it into the instructions as a prohibition and run ten tasks
- b)Upload more old releases to the knowledge so the model gets retrained
- c)Correct it in the chat; the model will learn from the fix next time
answer
a) Write it into the instructions as a prohibition and run ten tasksA project doesn’t train the model, it only changes the brief: whatever the assistant gets “almost” right goes into the instructions as a prohibition and is checked on ten real tasks (section 9)
For next time
Student presentation at the start of lesson 13 Psychology
Bring one price list or offer (a gym, an app, flights) and show how it nudges you to buy.
5 minutes, one student or a pair, three slides at most or a phone on the projector
Sources worth clicking
- 1Reuters Institute: Digital News Report 2026, executive summary ↗ · 48 markets, 97,520 people: social and video narrowly ahead of TV, trust at 37%, AI chatbots for news 10% weekly.
- 2Pew Research: Google users are less likely to click on links when an AI summary appears ↗ · The only public study of actual behavior: 8% clicks with an AI summary instead of 15%.
- 3DataReportal: Digital 2026 Czechia ↗ · Ad reach by platform in Czechia, internet and social media users; the source of the chart.
- 4AMI Digital Index 2026 ↗ · How many minutes a day Czechs spend on social media, by generation; the source of the chart (in Czech).
- 5chiefmartec: 2026 Marketing Technology Landscape ↗ · 15,505 marketing tools and the first year without growth: why simplicity is a trend.
- 6EU AI Act: Implementation timeline ↗ · The exact dates of what applies when; the only page on the AI Act you need.
- 7Kantar: Media Reactions 2026 ↗ · 23,000 consumers, 800 marketers: where marketers want to invest and what people trust.
- 8Dan McKinley: Choose Boring Technology ↗ · Three innovation tokens per company; the best piece on why not to buy every new thing.
- 9Gartner hype cycle (Wikipedia) ↗ · Five phases and the criticism: why the curve isn’t a law, but a language.
Rabbit holes
- Quote Investigator: It Is Not the Strongest of the Species that Survives ↗ · How a 1963 sentence from a management professor became “Darwin.”
- Blockbuster (Wikipedia) ↗ · 9,000 rental stores, a rejected Netflix for $50 million, and one last store in Oregon.
- Sphere Las Vegas (Wikipedia) ↗ · $2.3 billion, a 16K screen of 15,000 m² and 54,000 m² of LED on the outside.
- Anthropic: Collaborate with Claude on Projects ↗ · What exactly a project can do: 200,000 tokens of context, instructions, knowledge.
- n8n on GitHub ↗ · Fair-code automation with 207k stars; for when you want your data in-house.
- Pew Research: Teens, Social Media and Technology 2024 ↗ · Nearly half of teens online “almost constantly”; YouTube 90%.
- Restrictions on TikTok in the United States (Wikipedia) ↗ · The whole story, from the 2024 law to TikTok USDS in January 2026.
- Stack Overflow Developer Survey 2025: AI ↗ · 84% use AI, 33% trust it; “almost right” as the biggest frustration.